Feature Guide
Diagrams, Concept Maps, and Word Clouds
Use DrawSplatTM thinking tools to organize vocabulary, show relationships, plan processes, and turn text into visual structures.
Tools in this guide
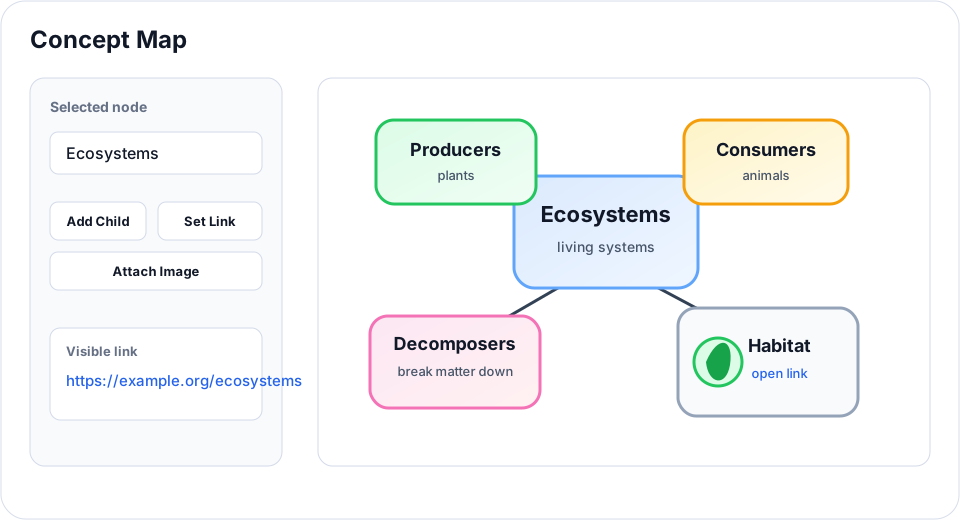
- Concept Map: create editable nodes, links, images, and connectors.
- Mermaid Diagram: render flowcharts and other Mermaid diagrams locally.
- Word Cloud: turn word lists into shaped visual summaries.
- Connectors: draw labeled relationships between objects.
Classroom uses
- Build vocabulary maps with examples, non-examples, and pictures.
- Map cause and effect in science, history, or literature.
- Ask students to make a flowchart of a procedure or story sequence.
- Paste class brainstorm words into a word cloud and discuss repeated themes.
Concept map workflow
- Open the Concept Map tool.
- Add one idea per line. Use indented or child lines for connected ideas.
- Add links or images when a node should connect to a source or visual.
- Insert the map, then move nodes and connectors directly on the board.
- Double-click or use the inspector to refine labels, shapes, links, and images.
Tips
- Use short node labels; put longer explanations in nearby sticky notes.
- Use labeled connectors for relationships such as "causes," "supports," "contrasts," or "leads to."
- Keep Mermaid diagrams simple for students; use them when typed structure is faster than hand-arranging shapes.
- Use word clouds as discussion starters, not final evidence. Ask students to explain why important words appear larger or smaller.
Advanced Concept Map features
- Three-tier visual hierarchy. Tag each node with
level: 1(main idea),2(directly connected), or3(supporting detail). Box dimensions and font sizes scale automatically so the visual weight matches the idea's importance. - Section filter. Tag nodes with an optional
sectionstring (e.g., "Inputs", "Process", "Outputs"). A pill row appears above the canvas; click a section to focus on it (others fade). Lets a large map double as multiple smaller views. - Outline view. Toggle the panel under the canvas to see the map rendered as a traditional academic outline (Roman → Letter → Number → letter) with an always-emitted "Next Steps and Action Items" section. Copy as Markdown or hand off to Markdown Studio with one click.
- Markdown Studio handoff. Click Open in Markdown Studio → in the outline panel to send the outline to Markdown Studio for further editing. The reverse direction also works: type headings in Markdown Studio and click Open in Concept Map Studio → to convert
# / ## / ### / -structure into a level-1/2/3 map with radial auto-layout. - Hold Space + drag to pan the canvas without flipping the Pan toggle (matches Figma / Photoshop / Lucidchart).
- Copy Embed Code generates an
<iframe>snippet you can paste into Google Sites or WordPress to embed a live, pan/zoom/clickable version of the map (read-only). Copy Embed Link gives just the URL. - Format spec for AI chatbots. Click format spec (v2) in the sidebar hint to download
drawsplat-concept-map-schema-v2.json. Hand it to ChatGPT / Claude / Gemini with your prompt and the resulting JSON loads directly via Load .json. The loader also auto-migrates older shapes (v1 nodes-as-object format, missing fields, etc.) so legacy saves still open. - Overlap resolver on import. Loading a JSON whose author placed nodes at overlapping coordinates triggers a five-phase separator (within-group / loose-vs-loose / rigid group-vs-group / loose-vs-foreign-group / cleanup) so the map opens readable, not piled up.