Feature Guide
Graphs and Picture Graphs
Use DrawSplatTM graph tools to turn class data into visual displays students can discuss, annotate, and revise.
Graph types
- Bar graph: compare categories and counts.
- Line or area graph: show change over time.
- Pie chart: show parts of a whole.
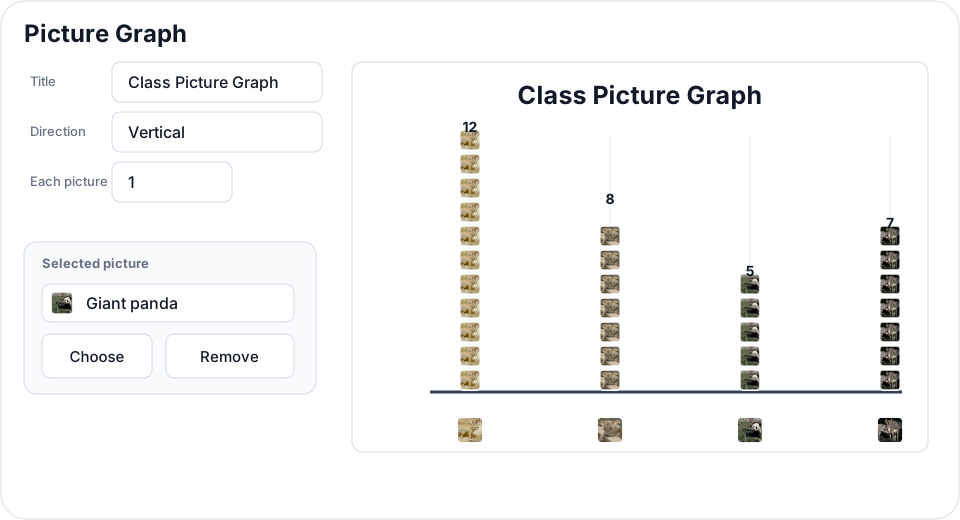
- Picture graph: use repeated icons or images to represent values.
Classroom uses
- Graph quick poll results from the class.
- Build math talks around misleading or incomplete graphs.
- Let students create a graph, then annotate what they notice and wonder.
- Use picture graphs with animals, symbols, or student-selected images for younger learners.
How to build one
- Open Insert or the Simple toolbar and choose a graph tool.
- Enter a title and data rows. Keep labels short for readability.
- Choose the graph type, direction, scale, and whether to show value labels.
- Preview the graph, then insert it onto the board.
- Double-click supported inserted graphs to edit them again.
Teaching moves
- Ask students to add a sticky note explaining the biggest difference in the graph.
- Have groups duplicate a graph and change one variable to compare outcomes.
- Use arrows or callouts to label peaks, trends, outliers, and comparisons.